Power Plant - AI Powered Environment, Health and Safety System : What Power Plant Leaders Should See in an AI-Enabled EHS Dashboard
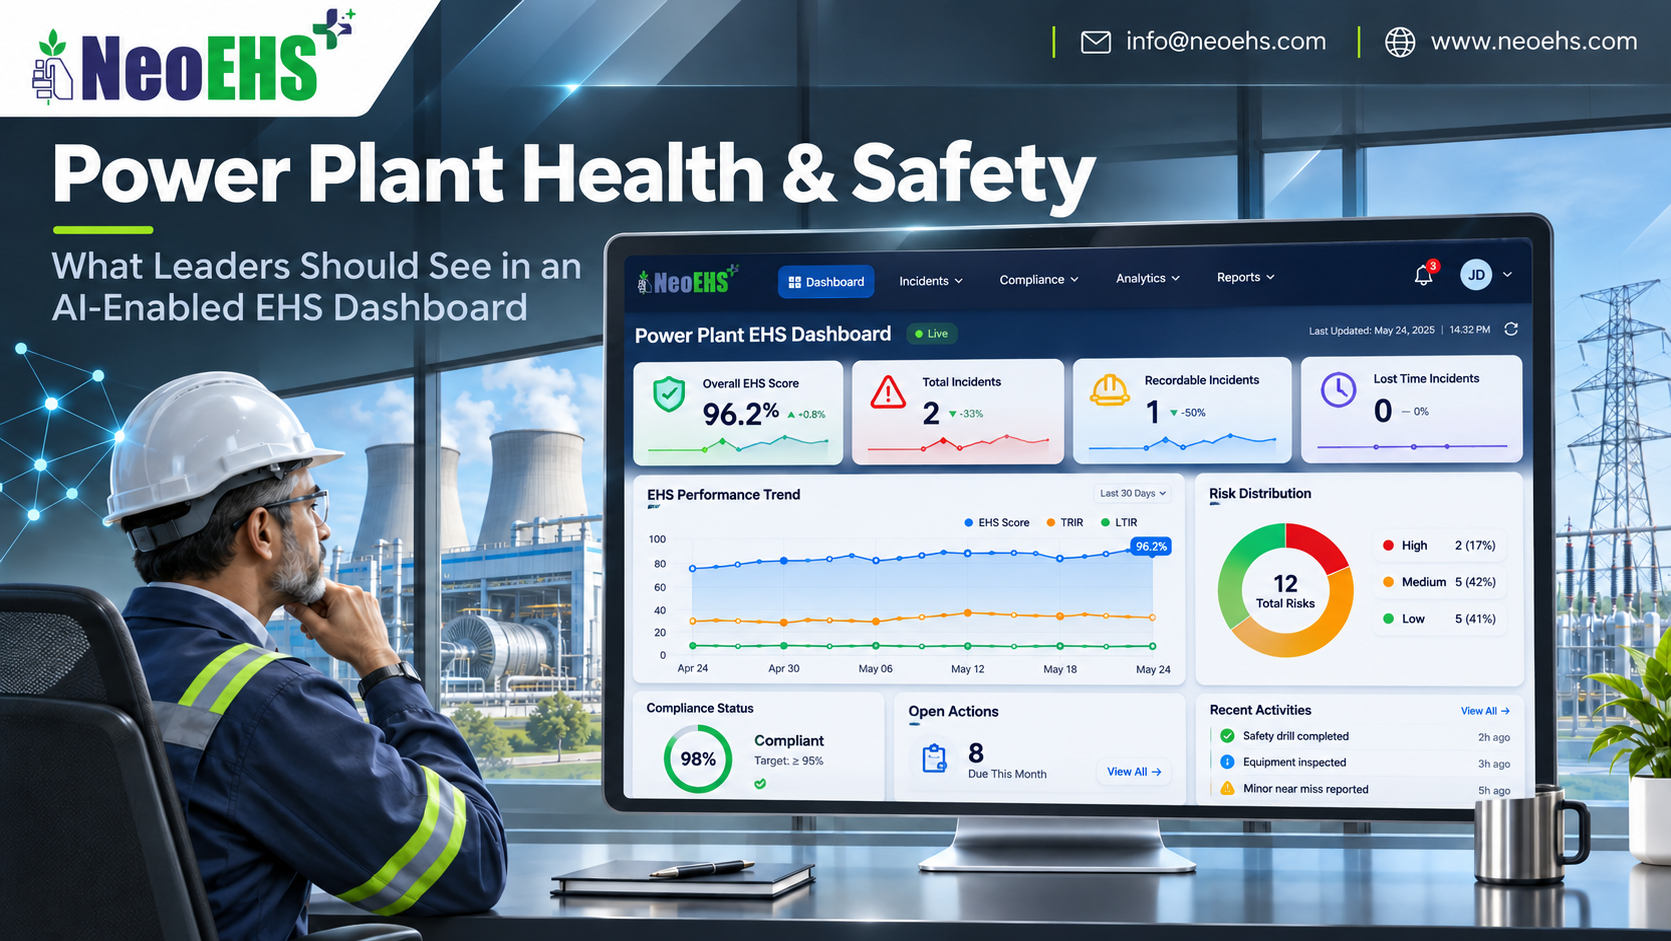
Power plant leaders need information that helps them decide where to look, which questions to ask and who needs to act. An AI-enabled EHS dashboard should bring that information into view.
What should a power plant EHS dashboard show?
An AI-enabled EHS dashboard for power plants should show critical risks, control-verification status, high-risk work, occupational health priorities, significant incidents, overdue actions and data quality. Each priority should link to its location, evidence, responsible person and next step. AI insights should explain their basis and limitations.
That gives leaders a practical starting point for reviewing health and safety across the plant.
Begin with decisions, then choose the indicators
It is tempting to start a dashboard project by listing every available metric. A better starting point is the decision each metric should support.
A plant manager may need to know which unresolved concerns require resources. An outage manager may need to review overlapping activities. An EHS leader may need to check whether repeated findings indicate an ineffective control.
Those questions require different views.
A useful dashboard can provide a common overview while allowing authorised users to examine the underlying records. Every chart should help answer a question someone is responsible for addressing.
Eight areas leaders should be able to review
1. Critical risks and the status of their controls
The first view should identify significant unresolved concerns and the controls associated with them.
Depending on the plant and activity, these could involve electrical energy, pressure systems, confined spaces, lifting operations, work at height or hazardous substances.
For each priority, leaders should be able to see:
-
The affected equipment, area or activity.
-
The potential consequence.
-
The relevant control and its responsible owner.
-
The latest verification result.
-
Any outstanding action or review.
A completed inspection count is useful, but it does not establish that a particular critical control is effective.
HSE’s guidance on developing process safety indicators offers a framework for monitoring control over major-hazard risks. Its principles can inform a plant-specific approach.
2. High-risk work and coordination needs
A total number of permits provides limited context. Leaders also need to understand the activities behind that number.
A useful view can show work awaiting authorisation, suspended activities and outstanding checks, according to the site’s configured workflow. Location and timing help reviewers identify activities that may require coordination.
NeoEHS Permit to Work software supports digital work-authorisation processes.
The dashboard should show recorded status clearly. It must not imply that a permit approval, on its own, proves that physical conditions remain safe.
3. Occupational health priorities
Worker health deserves a visible place alongside incident statistics.
A leadership view could include the status of exposure assessments, planned monitoring, health-related corrective actions and aggregate completion of required occupational health activities.
For example, a team might need to review overdue noise assessments or follow-up actions associated with dust, heat or chemical exposure. The relevant priorities depend on the plant’s assessed risks.
Keep individual medical information restricted to appropriately authorised professionals. A general management dashboard should show the operational follow-up leaders need without exposing diagnoses or confidential clinical records.
These are dashboard design requirements to assess during implementation—not a claim that every health workflow is included by default.
4. Corrective actions that remain unresolved—or keep returning
An overall closure percentage can hide important differences.
Several minor actions may be completed while one significant concern remains open. An action may also be closed administratively without checking whether the response worked.
Leaders should be able to review actions by priority, age, owner and affected activity. Reopened actions and recurring findings deserve particular attention.
Useful questions include:
-
Which priority actions are overdue?
-
Which need resources or a management decision?
-
Which have completion evidence awaiting verification?
-
Where has the same concern returned?
NeoEHS Risk Management connects risk assessment and control information with corrective and preventive action workflows.
5. Significant incidents, near misses and lessons applied
Injury and incident records remain important. They explain what has happened and support investigation.
However, the absence of a reported injury does not establish that every significant risk is controlled.
A leadership dashboard should help reviewers distinguish actual consequences from potential consequences, using an agreed assessment method. It should also show whether investigation actions have been implemented and whether lessons apply elsewhere.
NeoEHS Incident Management supports reporting, investigation and action tracking.
6. Leading indicators alongside historical outcomes
Leading indicators examine activities and conditions that can help reveal developing problems. Lagging indicators describe outcomes that have already occurred.
OSHA’s leading-indicator guidance encourages using both perspectives in a safety and health programme.
For a power plant, a balanced review might include control-check completion, response times, repeat findings and overdue actions alongside injuries and other recorded events.
Each measure needs a clear definition, reporting period and denominator.
For example:
On-time verification rate = checks completed by their due time ÷ checks due in the period × 100.
Also show how many completed checks found a control ineffective. Otherwise, a high completion rate could be mistaken for evidence that all controls passed.
7. AI insights that can be examined
AI can help group similar observations, identify recurring themes and draft summaries of records for review. Predictive models may also support prioritisation where suitable data and validation are available.
The dashboard should explain:
-
Which records contributed to the insight.
-
The period and locations covered.
-
Why the issue was highlighted.
-
Whether information is missing.
-
Who has reviewed the output.
A generated explanation is not proof of causation. Nor should a risk score be presented as a calibrated probability unless that interpretation has been validated.
NeoEHS predictive analytics provides a relevant starting point for discussing these capabilities and their implementation scope.
8. Data freshness and coverage
A dashboard should make uncertainty visible.
When was the information captured? When was it synchronised? Are all departments included? Are contractor records complete? Is an integration delayed?
Distinguish a confirmed zero from missing data. An area with no submitted observations should not automatically appear green.
Where information is stale or incomplete, label it clearly. Leaders need to know when they are reviewing a partial picture.
A practical dashboard structure
A useful design can have three levels:
First: decisions requiring attention.
Significant unresolved concerns, failed control checks and actions needing leadership support.
Second: patterns and performance.
Trends in findings, occupational health follow-up, action effectiveness and incident learning.
Third: supporting evidence.
Source records, timestamps, photographs, approvals and verification details, subject to access permissions.
This gives leaders a manageable overview with a route to the evidence behind it.
The EHS dashboard supports management review. It does not replace plant alarms, DCS, SCADA or safety instrumented systems.
An example: when a positive headline hides a concern
This is an illustrative scenario, not a customer case study.
A plant reports that most planned inspections have been completed. The headline indicator looks positive.
A closer view shows that several findings relate to the same maintenance area. One action has been reopened, and a control verification is overdue before further work is planned.
The dashboard brings those records together. The responsible manager reviews the evidence, coordinates with the relevant teams and ensures decisions follow the site’s work-control procedures.
The useful outcome is a clearer decision based on connected information—not the colour of the headline indicator.
Avoid misleading comparisons
Comparing units or contractors requires context.
Raw incident counts can reflect different workforce sizes, hours worked, activities and reporting practices. A rise in observations may indicate stronger participation rather than worsening conditions.
Show definitions, scope and exposure denominators where relevant. Explain exclusions and changes in methodology.
The dashboard should support learning and accountability without encouraging teams to suppress reports to improve their appearance.
How NeoEHS fits into the leadership view
NeoEHS offers EHS solutions for Power & Energy, with related workflows for risk management, permits, incidents and inspections.
Digital inspection records can provide part of the evidence needed for management review. Connected workflows help users move from an overview to the underlying concern and its follow-up.
The dashboard views described here are a recommended design brief. Available fields, AI functions, health workflows, refresh rates and integrations should be confirmed for the proposed implementation.
Frequently asked questions
Which indicators belong on the first screen?
Prioritise significant unresolved risks, control-verification failures, high-risk work exceptions and overdue actions needing intervention. Include enough context to identify the owner and next step.
Are low injury rates enough to show that a plant is safe?
No. Injury rates describe recorded outcomes. Leaders also need evidence about current controls, exposures, work conditions and unresolved concerns.
What makes an EHS dashboard AI-enabled?
AI may analyse report text, identify patterns or generate summaries and model-based estimates. Charts, reminders and fixed thresholds can operate without AI.
Should leaders see individual employee health records?
A general leadership dashboard should normally show aggregate health-programme information and necessary operational actions. Access to identifiable medical information requires appropriate authorisation and safeguards.
How often should the dashboard update?
Set refresh requirements according to the decision and data source. Work-coordination records may require timely updates, while other reviews use periodic data. Display timestamps and delays clearly.
Can one overall safety score replace detailed indicators?
No. A combined score can hide a failed critical control or missing information. Keep significant exceptions visible and explain how any composite score is calculated.
Make the dashboard useful in the next meeting
Before adding another chart, ask: What decision will this help someone make?
A well-designed EHS dashboard helps power plant leaders identify concerns, examine the evidence and make responsibility clear. AI adds value when it makes that review more useful and understandable.
Request a NeoEHS demonstration to discuss a leadership dashboard built around your plant’s risks, workflows and reporting needs.

.png "NeoEHS AI-powered Mining solution for modern EHS management, enabling safer operations, compliance excellence, risk detection, and sustainable mining performance")